
About Me
Hi! I’m Chris, a data analyst and former math teacher.I specialize in data visualization, spatial analysis, and predictive modeling to drive decisions that make a positive impact on society.With a passion for solving complex problems, I turn data into actionable insights that empower organizations and communities.
Skills

Python | R | Tableau | Power BI | GIS | SQL | Excel | InDesign | Git
Data Analysis 2+ years
Data Visualization 2+ years
Project Management 5+ years
Data Reporting 1+ years
Spatial Analysis 1+ years
Predictive Modeling 1+ years
Featured Projects
SQL, PYTHON | DATA VISUALIZATION
Transit Ridership Analysis
SQL & Python project analyzing 1.25M+ CTA ‘L’ records to clean, merge, and visualize post-COVID ridership trends and accessibility gaps.
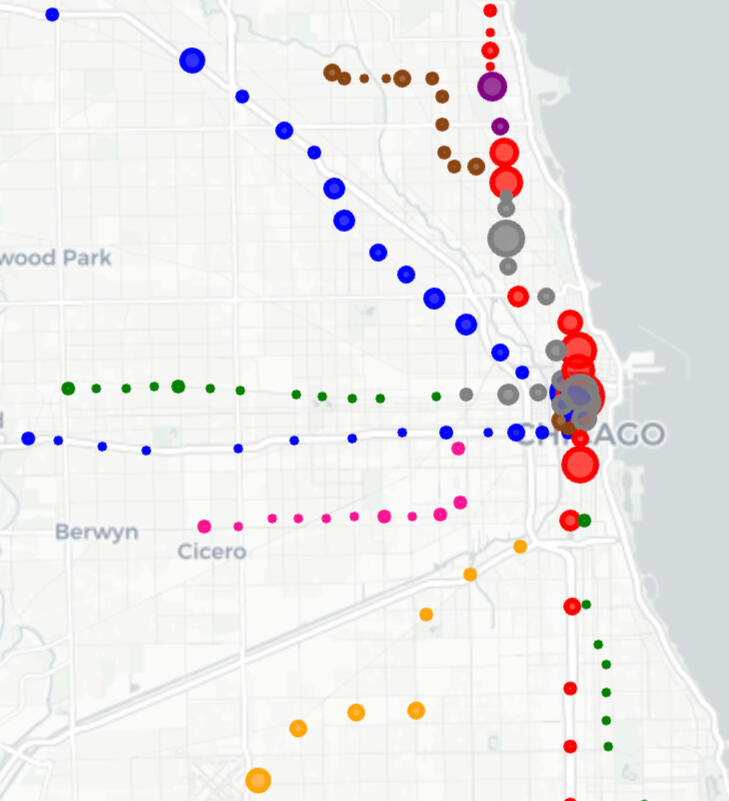
TABLEAU | DATA VISUALIZATION
Trees & Wealth Dashboard
Created Tableau dashboard to explore the relationship between wealth & trees in New York City.
PYTHON | MACHINE LEARNING
Traffic Crash Prediction
Machine learning classification project analyzing Chicago Crash Data to predict key contributors of fatal crashes.
EXCEL & CANVA | DATA ANALYSIS
ACT Program Evaluation Report
Created a comprehensive data report analyzing 8 years of high school data.
ARCGIS | GEOSPATIAL ANALYSIS
School Safe Zones
Geospatial analysis using ArcGIS to identify the five most dangerous school zones in Pasadena, CA for pedestrian and bicycle accidents.
R & TABLEAU | REGRESSION ANALYSIS
Gun Violence & Education Dashboard
Conducted regression analysis to explore the relationship between juvenile gun deaths and high school graduation rates across Chicago.
Professional Experience
DATA/POLICY ANALYST & PROJECT MANAGER - Cook County Office of Research, Operations & Innovation
LEAD STEM INSTRUCTOR & DATA REPORTING SPECIALIST - TEACH, LLC.
ARTIFICIAL INTELLIGENCE/MACHINE LEARNING INSTRUCTOR - Kode with Klossy
HIGH SCHOOL MATH TEACHER - School District of Philadelphia
SUPPLY CHAIN & OPERATIONS INTERN - Laborocity
Education

M.S. Education, University of Pennsylvania

Data Science Certificate, Flatiron School Bootcamp

B.S. Mathematics, University of Pittsburgh
Recent Blog Posts
STARTING A DATA CAREER: WHAT I LEARNED IN MY FIRST 90 DAYS
Key takeaways from my first quarter of my applied data fellowship
HOW TO USE DATA STORYTELLING TO CREATE EFFECTIVE AND IMPACTFUL VISUALS
Key data visualization strategies for effective storytelling
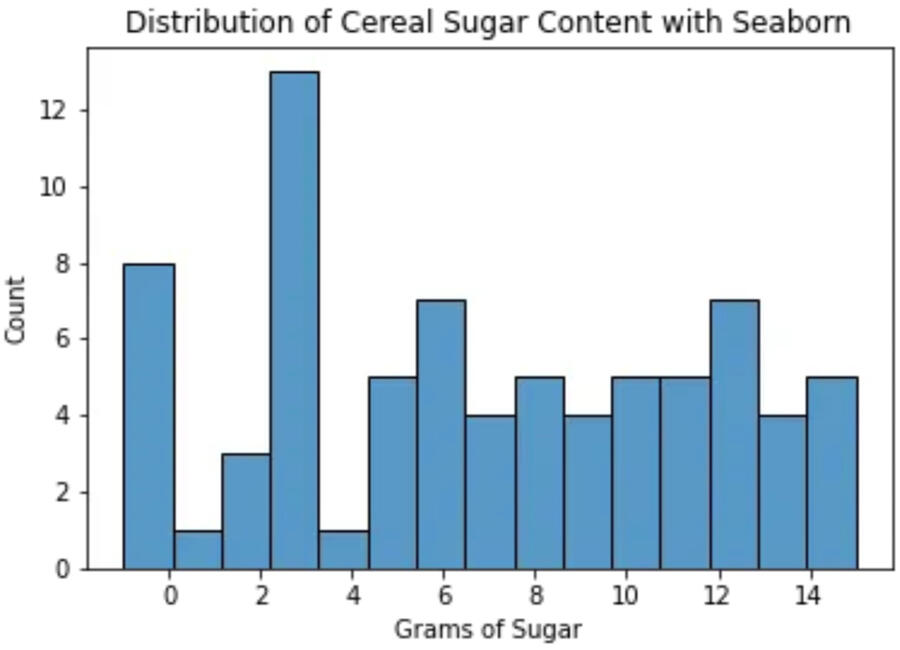
VISUALIZATION ESSENTIALS WITH MATPLOTLIB AND SEABORN
Learn the basics of creating data visualizations in Python
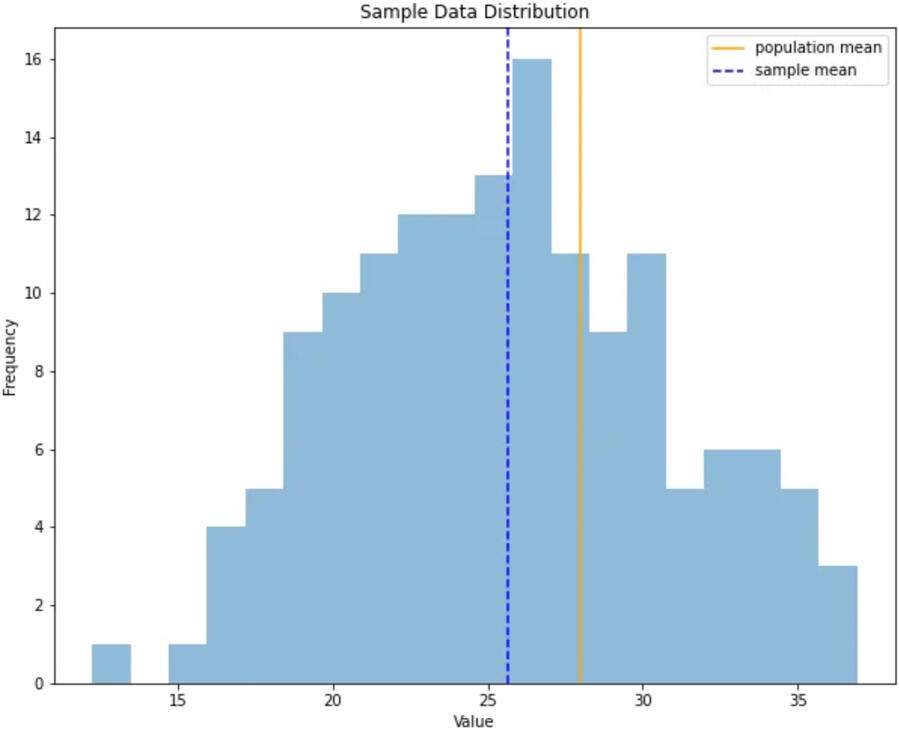
INTRO TO HYPOTHESIS TESTING IN PYTHON
Beginner’s guide to using Python to conduct and interpret hypothesis tests
Python | Machine Learning
Traffic Crash Prediction
OVERVIEW:This project analyzes Chicago’s crash data to identify factors influencing severe crashes, aiming to support Vision Zero initiatives and provide actionable insights for policymakers.DATA: Over 900k records on crash incidents, 1.98 million on individuals, and 1.84 million on vehicles.GOALS: Develop an inferential model to predict and identify factors leading to serious crashes, addressing challenges like class imbalance.MODELING STEPS:
1. Data Cleaning: Handled missing values, duplicates, outliers, and ensured proper formatting.
2. Data Splitting: Prepared training, validation, and test sets to prevent data leakage.
3. Baseline Models: Built logistic regression and decision tree models for initial comparisons.
4. Addressing Class Imbalance: Applied SMOTE, class weighting, and their combinations to address imbalances.
5. Hyperparameter Tuning: Used GridSearchCV to find optimal parameters, optimizing for PR AUC.
6. Model Selection: Chose the decision tree for its interpretability and strong performance.
7. Model Evaluation: Focused on evaluating feature importances from the decision tree to gain insights into key predictors.
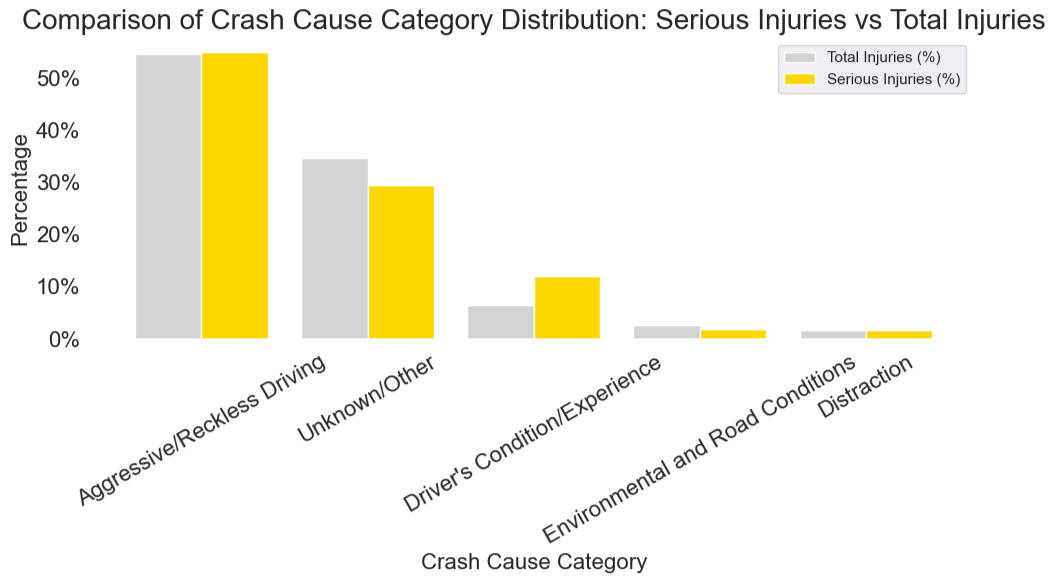
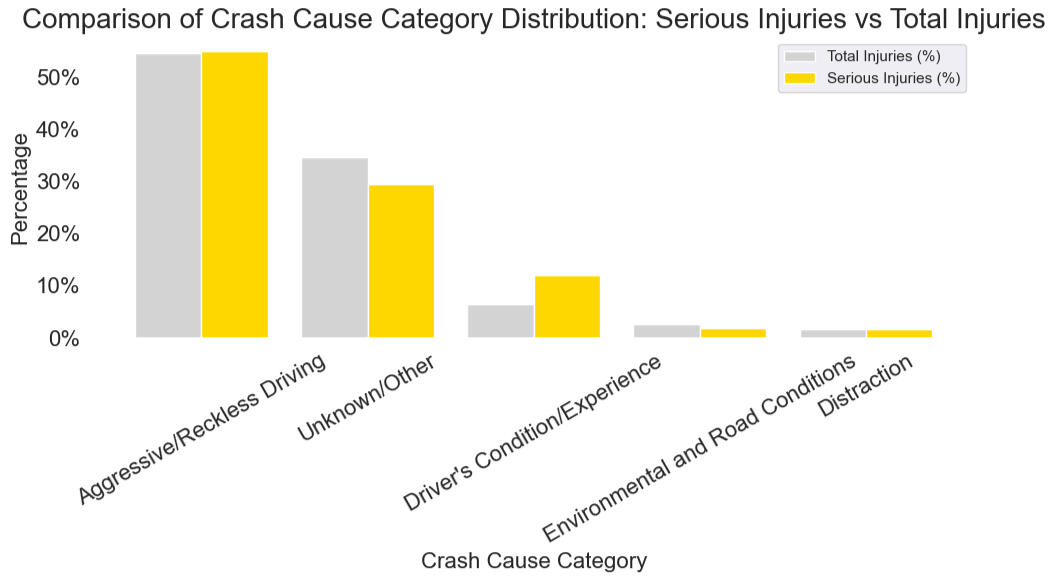
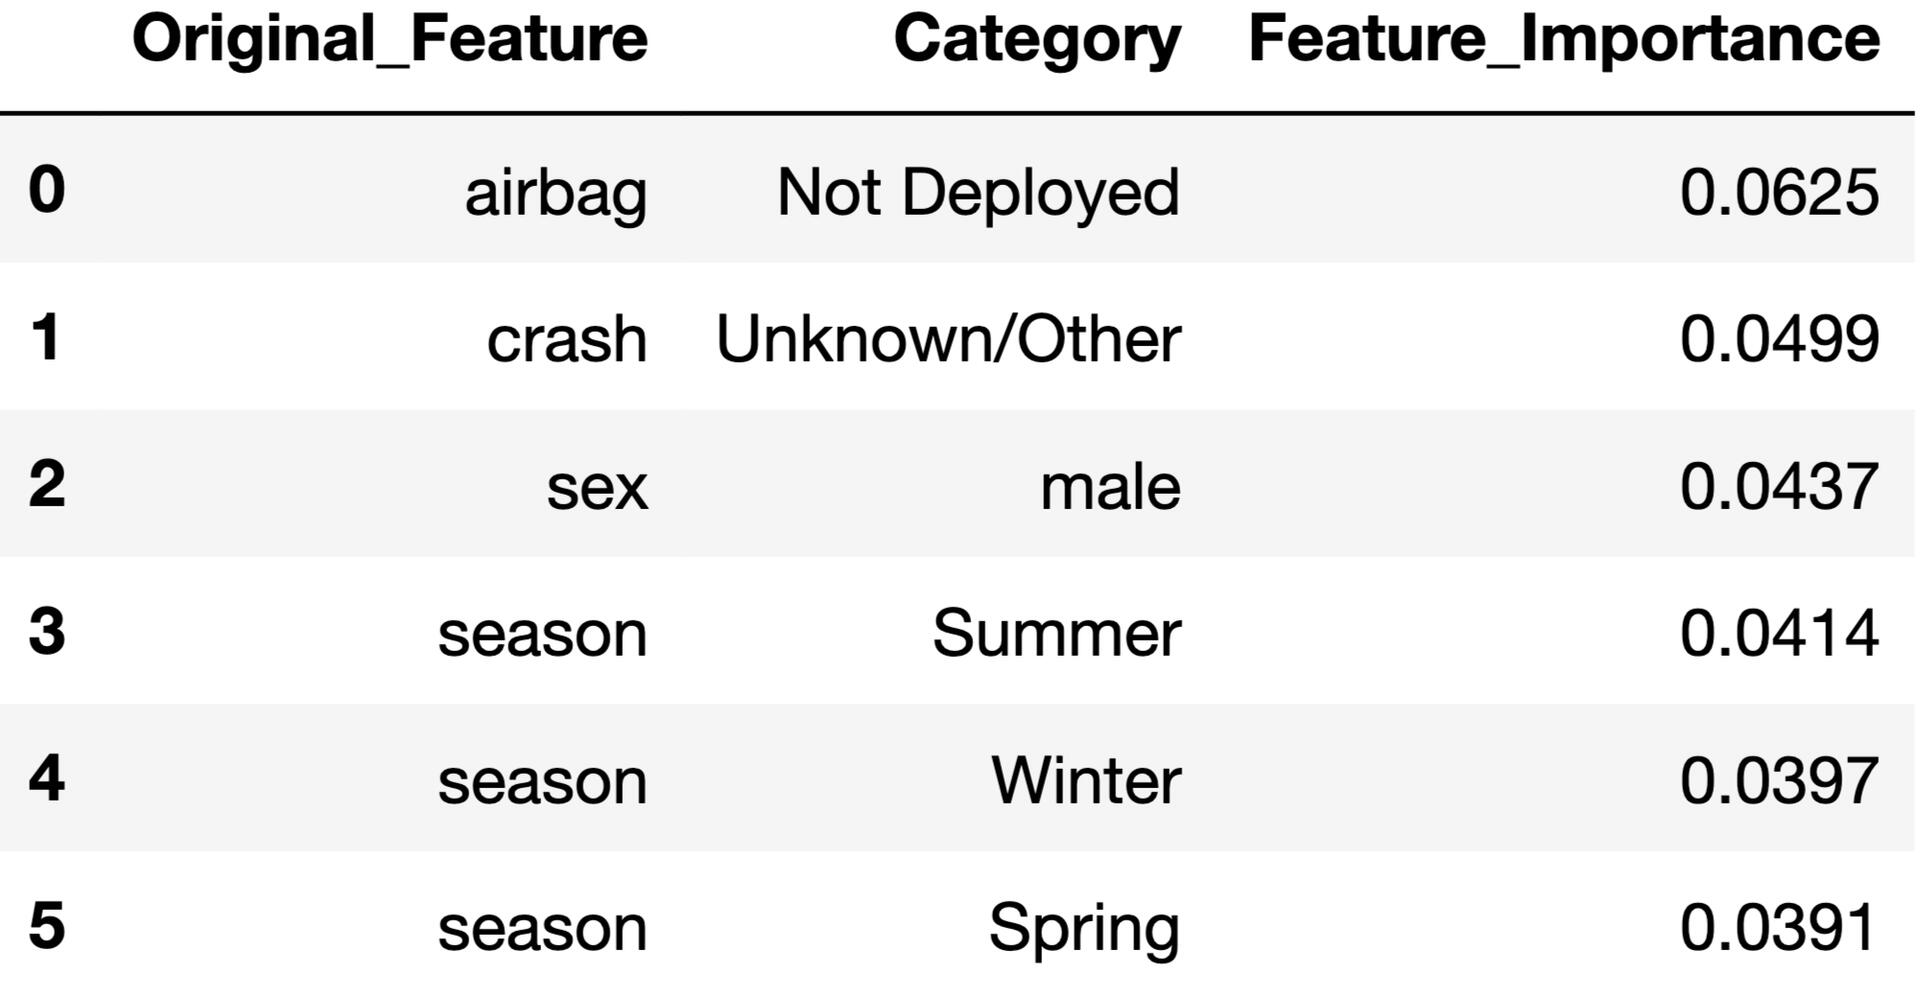
- INSIGHT #1: Overrepresented factors in severe crashes include airbag deployment, light condition, and males.
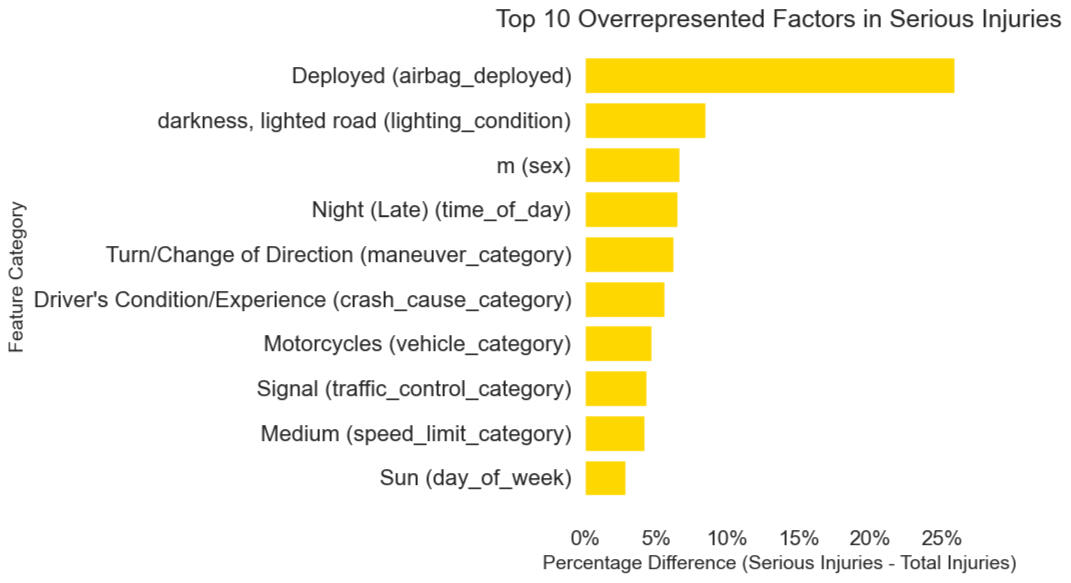
- INSIGHT #2: The top contributing factors identified in severe crashes are airbag deployment, males, and seasonality. The feature importance output from the decision tree model highlights these variables as having the greatest influence on crash severity.
RECOMMENDATIONS:
1. Male Injury Trends:
- Conduct further research to analyze trends in male driver involvement in serious crashes.
- Develop targeted safety campaigns focused on behaviors like speeding and aggressive driving.2. Vehicle Size and Speed Regulations:
- Implement city-specific tiered fees for heavier vehicles, using revenue to fund pedestrian and cyclist safety measures.3. Annual Airbag Inspections:
- Promote policies requiring annual airbag inspections to ensure functionality and compliance with safety standards.
The full project can be viewed on my github page: here
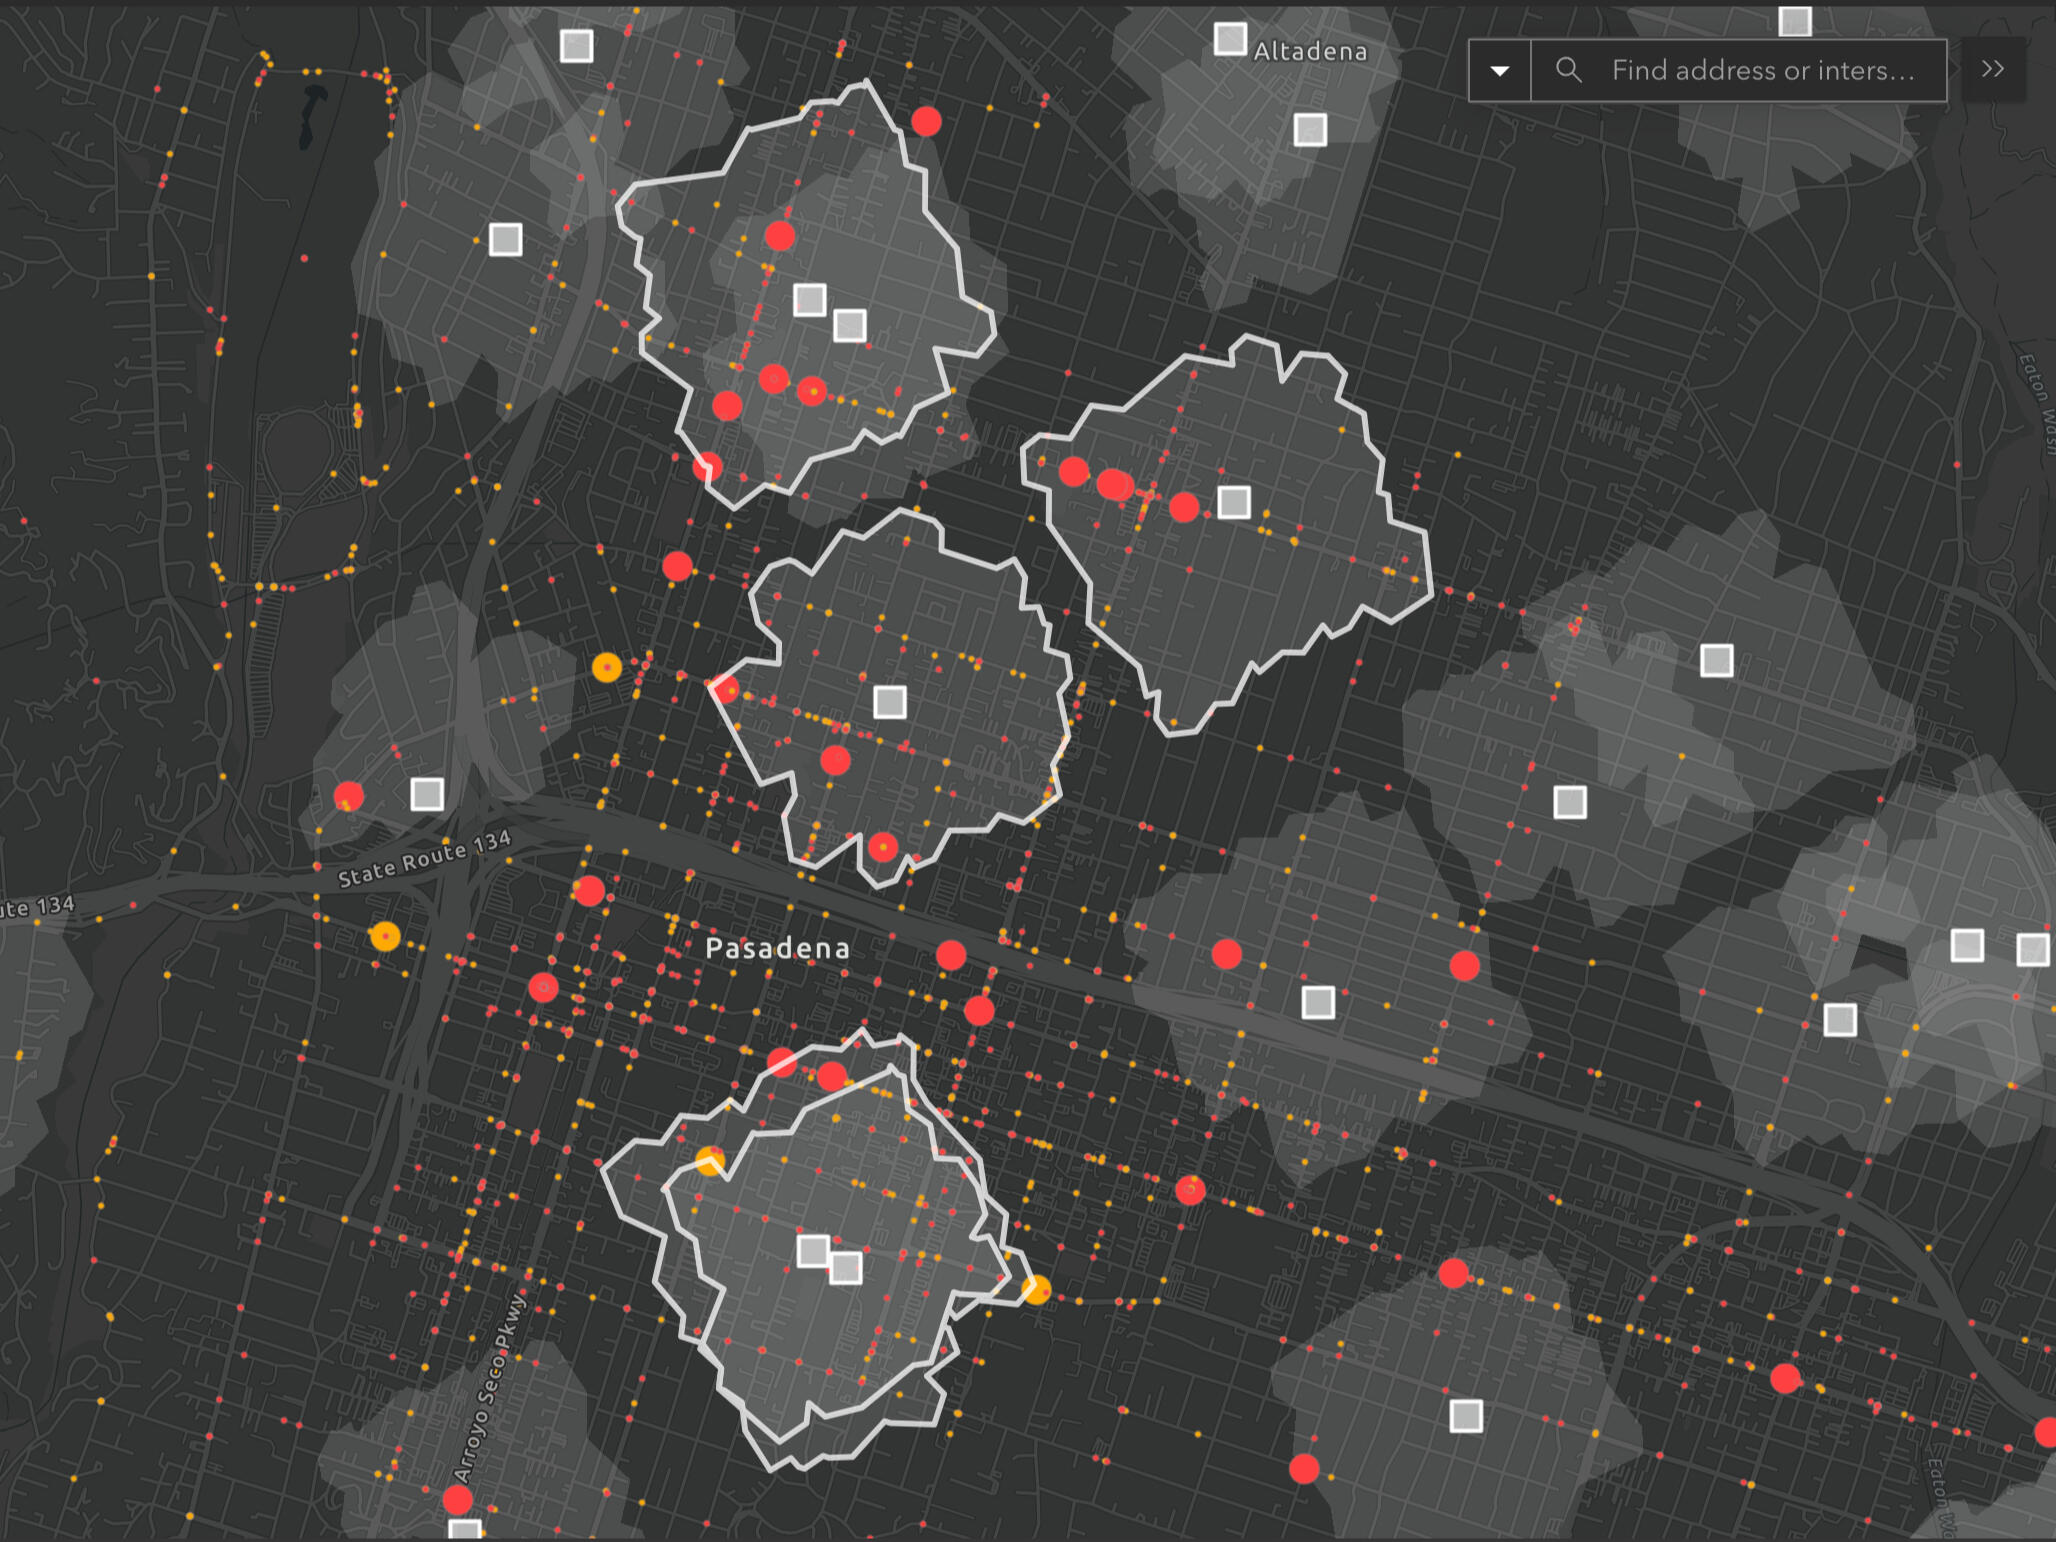
ArcGIS | Geospatial Analysis
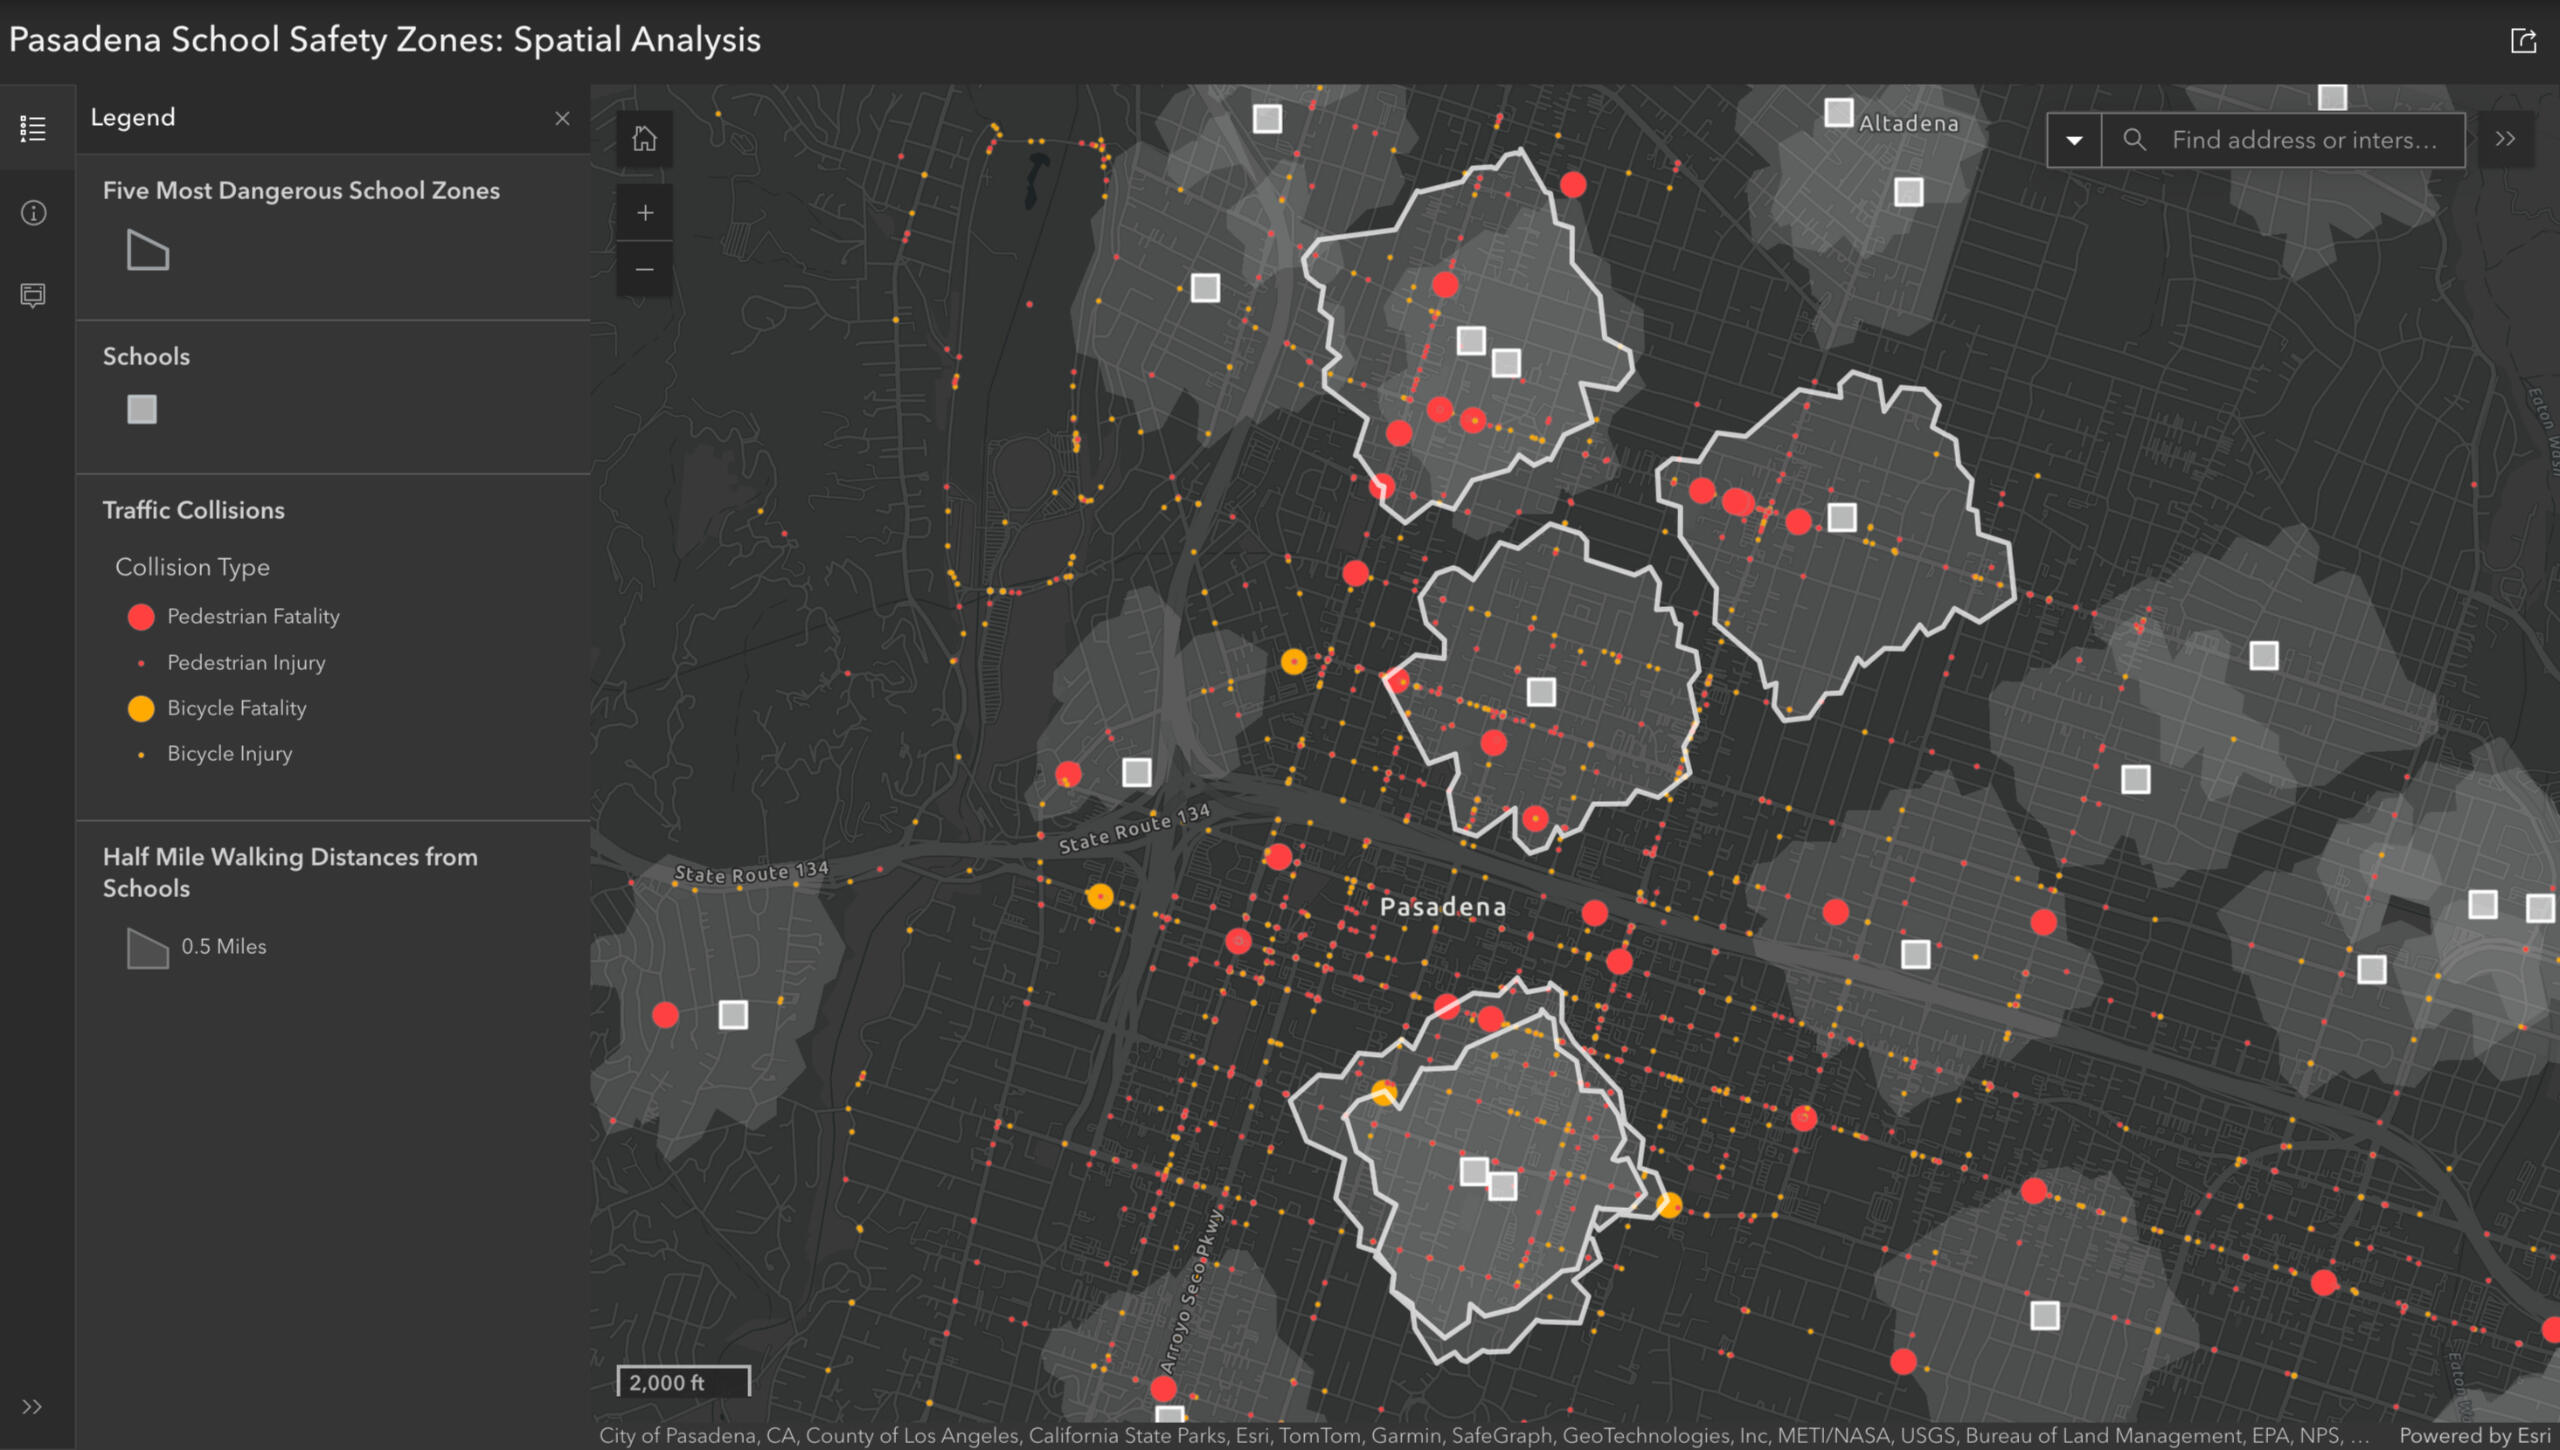
School Safe Zones
OVERVIEW:
Conducted a geospatial analysis using ArcGIS to identify the five most dangerous school zones in Pasadena, CA for pedestrian and bicycle accidents. The analysis supports data-driven policy interventions, such as implementing school slow zones to improve student safety. Findings were compiled in an ArcGIS app. This project was developed based on an Esri tutorial and adapted to emphasize policy-relevant insights.
Note: Due to licensing restrictions with my organization's ArcGIS account, the interactive map and app are not publicly shareable.DATA:
Source: Traffic collision data from the City of Pasadena
Scope: Over 26k reported traffic collisions across a 16-year span
Filtered Dataset: 2,441 incidents involving pedestrians and cyclists
GOALS:
Identify school zones with the highest rates of pedestrian and cyclist injuries
Support targeted safety improvements using spatial data
Provide city planners and school officials with a tool for prioritization
STEPS:
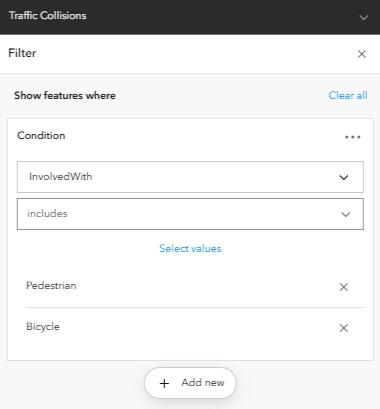
DATA FILTERING: Focused on incidents involving pedestrians and cyclists only. Cleaned and visualized 2,441 incidents.
GEOSPATIAL ANALYSIS: Applied point clustering, heat maps, and hot spot analysis to visualize accident concentrations.
CONTEXTUAL LAYERS: Added Pasadena Unified School District (PUSD) locations and generated half-mile walkable zones around each school.
PRIORITIZATION: Used spatial joins and summary statistics to count accidents per school zone. Filtered to highlight the top 5 most dangerous zones based on total number of incidents.
KEY INSIGHTS:
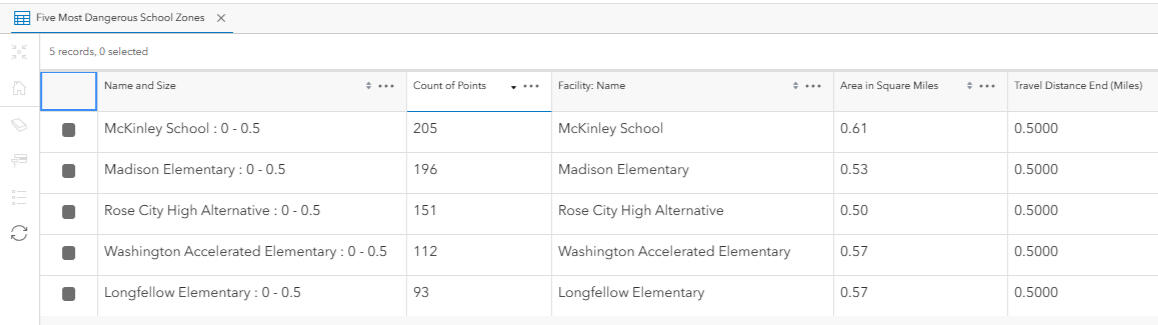
Disproportionate Risk: Just five school zones account for 757 pedestrian and cyclist collisions (over 30% of all such incidents citywide) despite covering a small geographic area. These findings underscore the need for targeted, place-based interventions.
High-Risk Schools Identified: McKinley School (205 incidents), Madison Elementary (196), Rose City High (151), Washington Elementary School (112), Longfellow Elementary (93)
Geographic Clustering: All five zones are located in central/northwest Pasadena, enabling localized, concentrated policy efforts.
POLICY RECOMMENDATIONS:
Implement School Slow Zones in the five highest-risk areas, including traffic calming measures, speed limit enforcement, and enhanced signage.
Prioritize Infrastructure Upgrades such as protected bike lanes, speed cushions, and intersection daylighting.
Deploy crossing guards and create highly visible crosswalks near the entrances of the five identified schools.
Use this Model as a Framework: The spatial analysis approach can be replicated for other risk-prone facilities like parks or transit hubs.
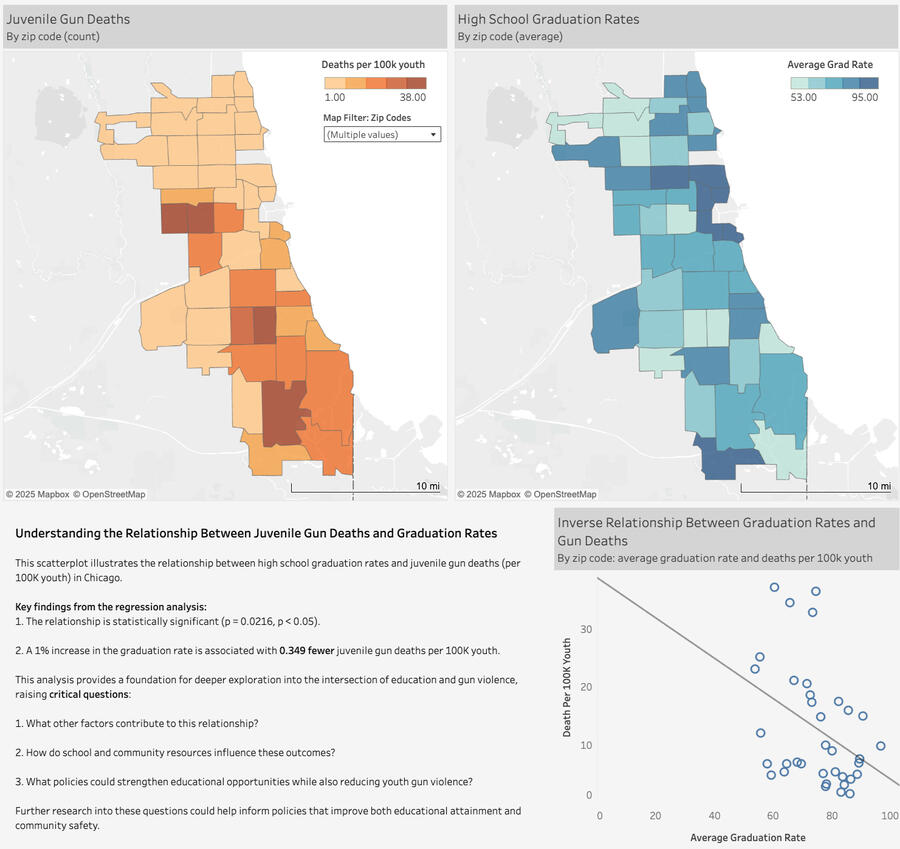
R & TABLEAU | REGRESSION ANALYSIS
Gun Violence & Education Dashboard
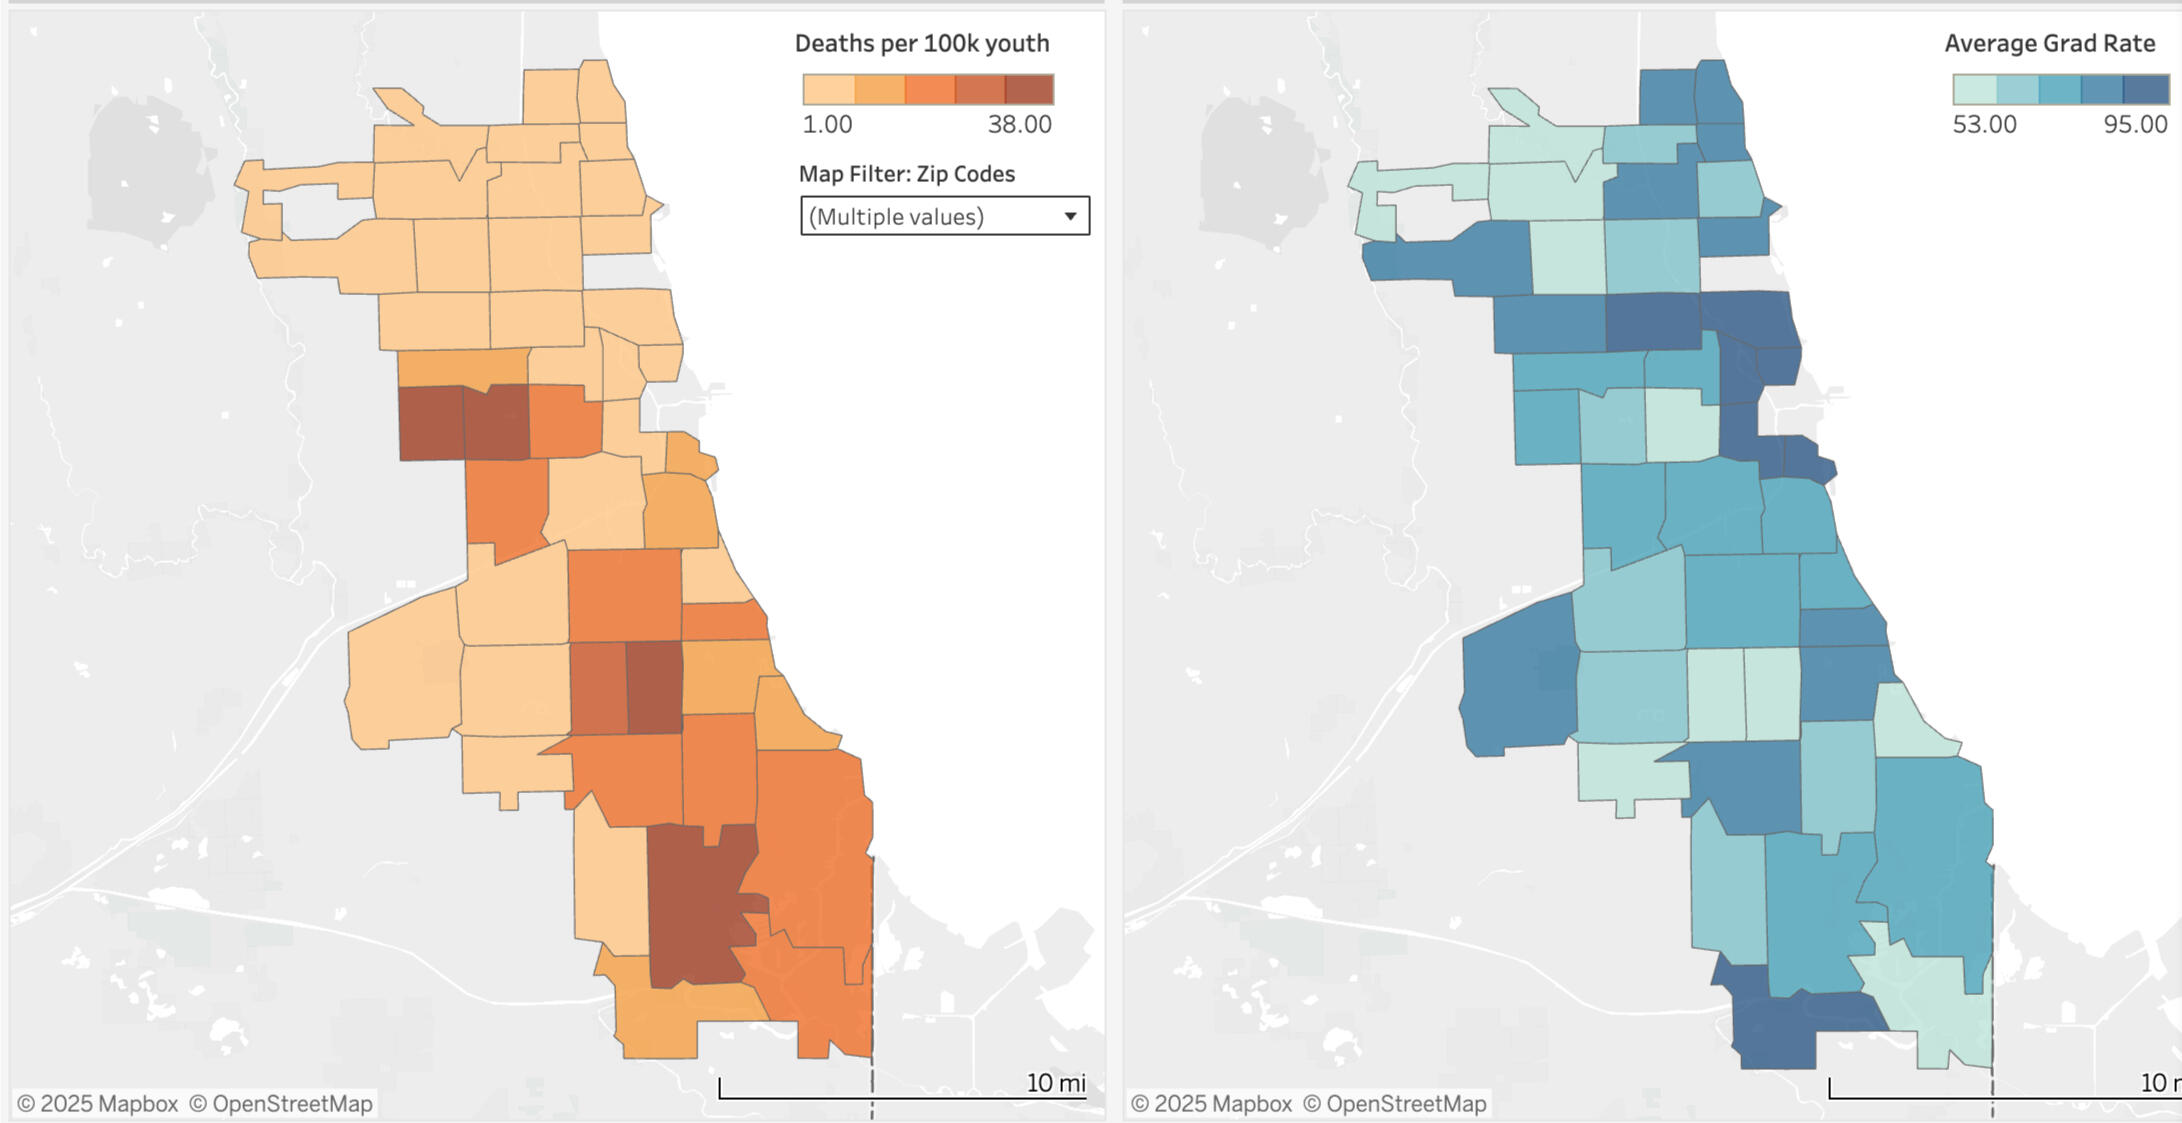
OVERVIEW:
Explored the relationship between youth gun deaths and high school graduation rates across Chicago ZIP codes using publicly available data (2018-2021). Conducted hypothesis test, and regression analysis, as well as created data visualizations, revealing a statistically significant inverse relationship between graduation rates and juvenile gun deaths.DATA:
Mortality Data: Juvenile (under 18) gun-related deaths in Chicago (2018–2021).
Education Data: 4-year high school graduation rates by ZIP code (2018–2021).
GOALS:
Explore the relationship between youth gun deaths and high school graduation rates by:
1. Conducting hypothesis test to determine the statistical significance of the relationship.
2. Performing regression analysis to quantify the strength and direction of this relationship.
3. Visualizing the data using maps and scatterplots to illustrate the relationship both geographically and quantitatively.
KEY INSIGHTS:
The relationship between graduation rates and juvenile gun deaths is inverse—as graduation rates increase, juvenile gun deaths decrease.
The relationship is statistically significant (p = 0.0216, p < 0.05).
For every 1% increase in the graduation rate, there is an associated decrease of 0.349 juvenile gun deaths per 100K youth.
The full project can be viewed on my github page: here
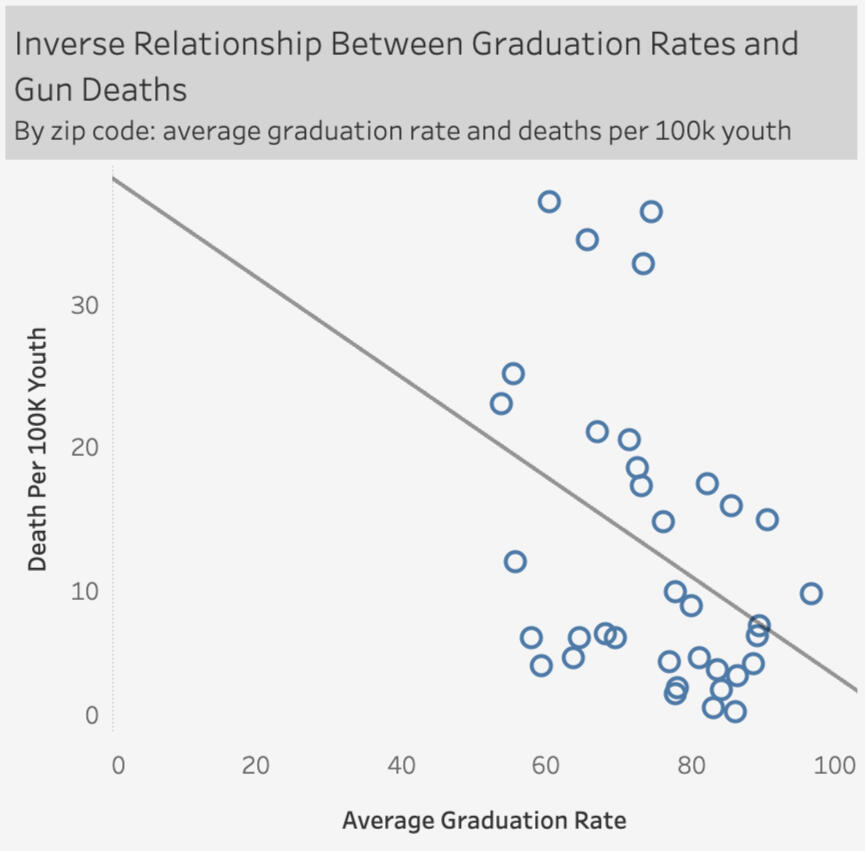
Excel & Canva | Data Analysis
ACT PROGRAM EVALUATION Report
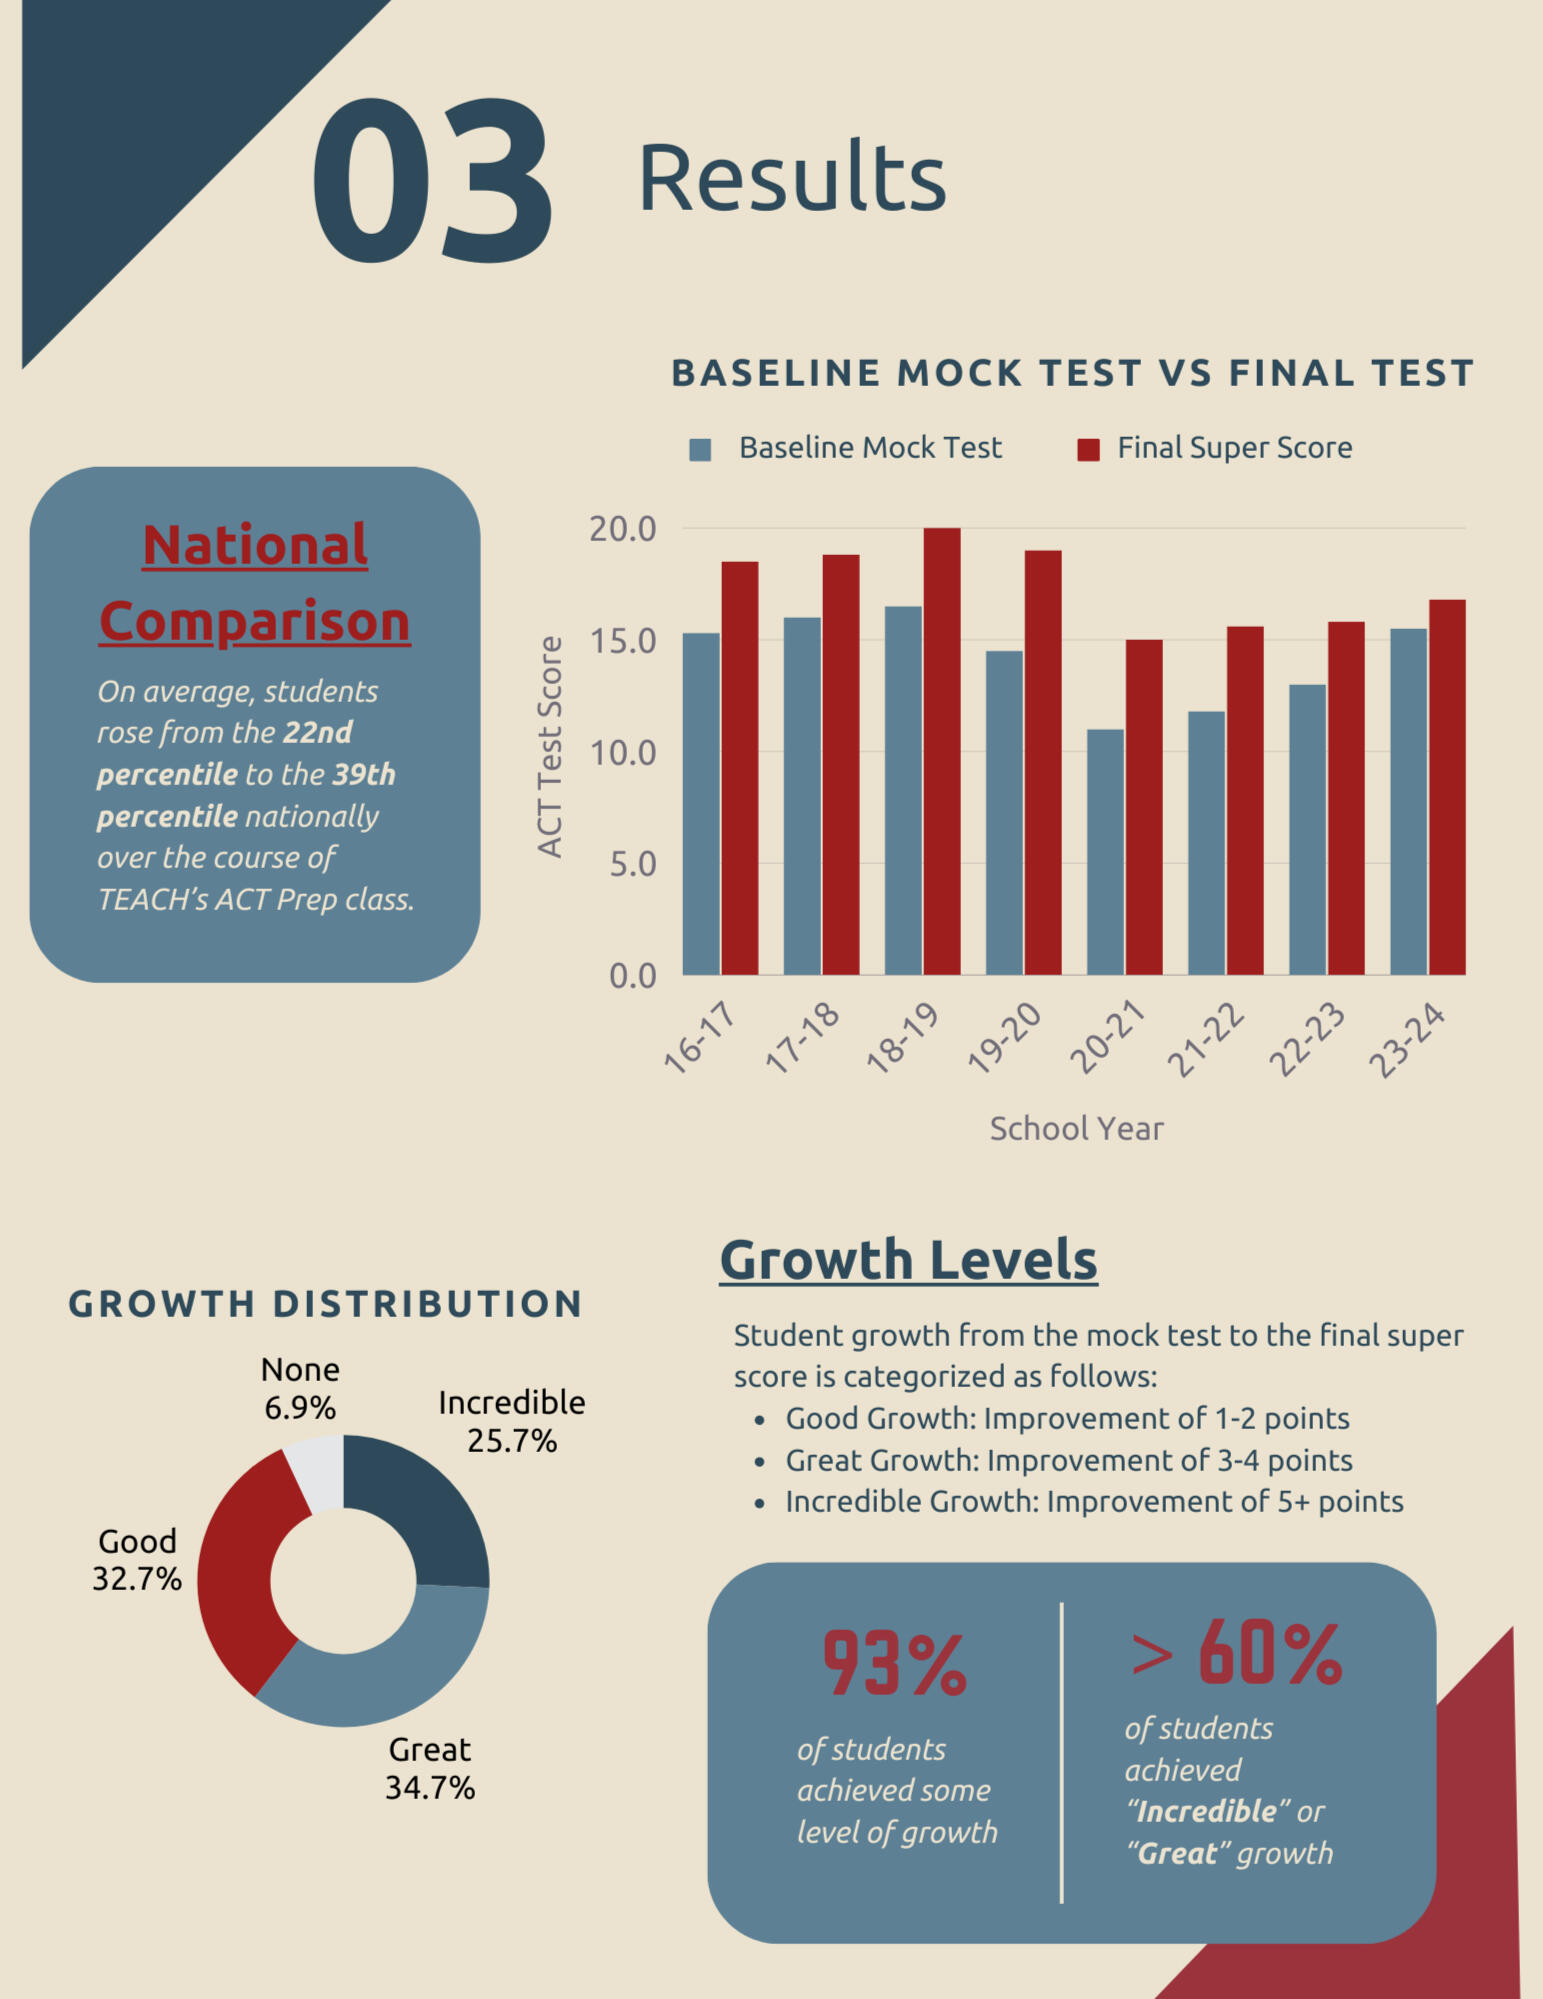
OVERVIEW:
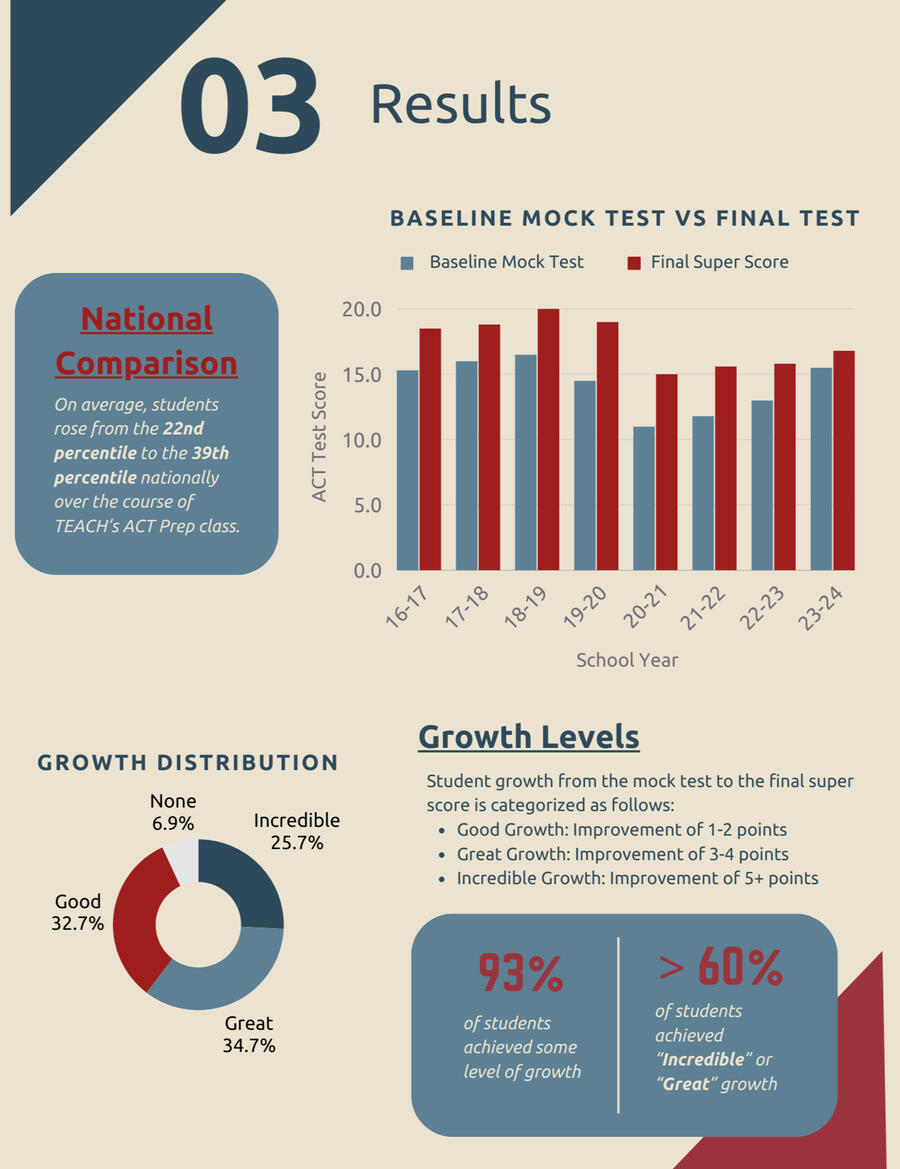
Developed a 5-page data report analyzing the effectiveness of the ACT Prep program over 8 years, summarizing key trends, improvements in scores, and national comparisons.DATA:
Analyzed data from 8 cohorts, serving 156 students with an average enrollment of 19.5 students per cohort.INSIGHTS
93% of students achieved growth
On average, students’ national percentiles increased by 17 points, rising from the 22nd to the 39th percentile during the ACT Prep class
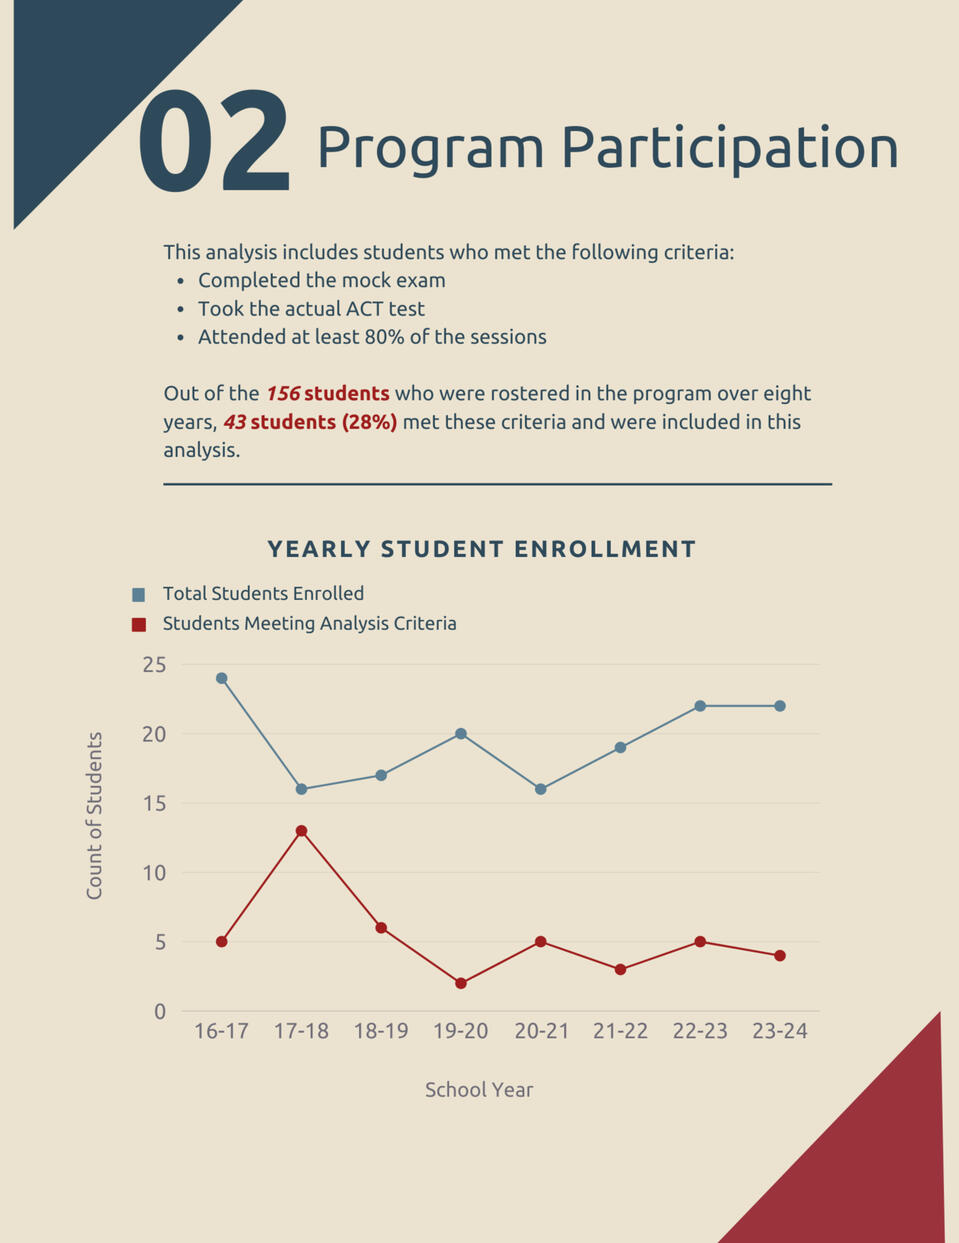
The full report can be viewed: here
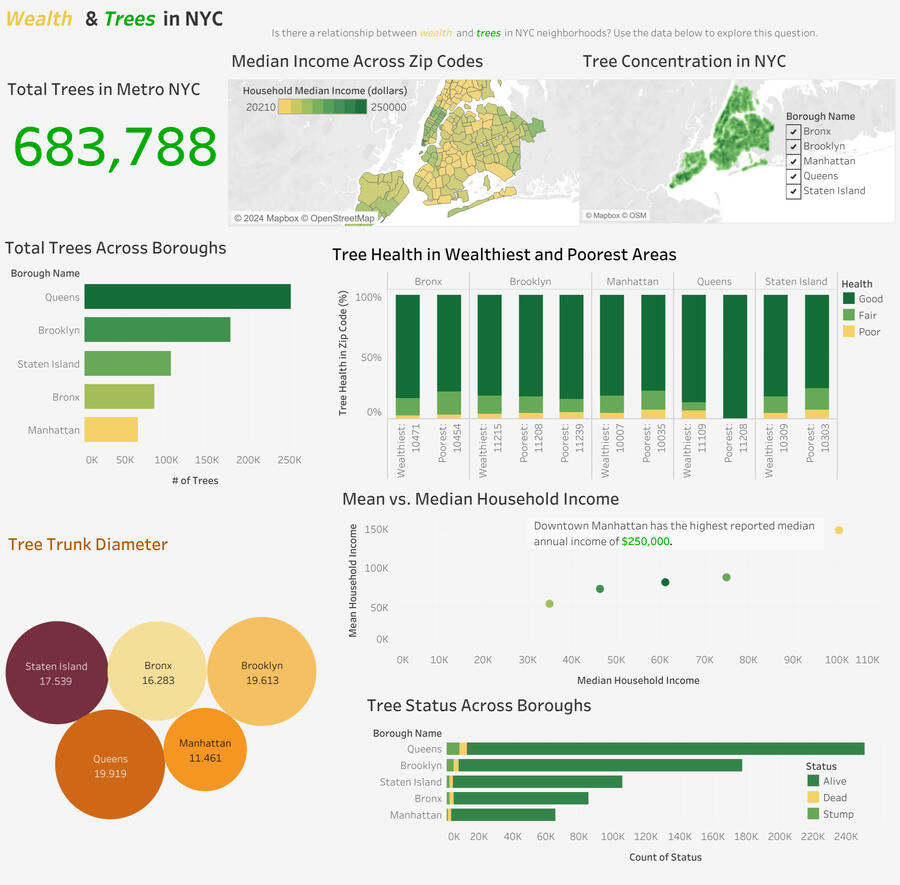
Tableau | Data Visualization
Trees & Wealth Dashboard
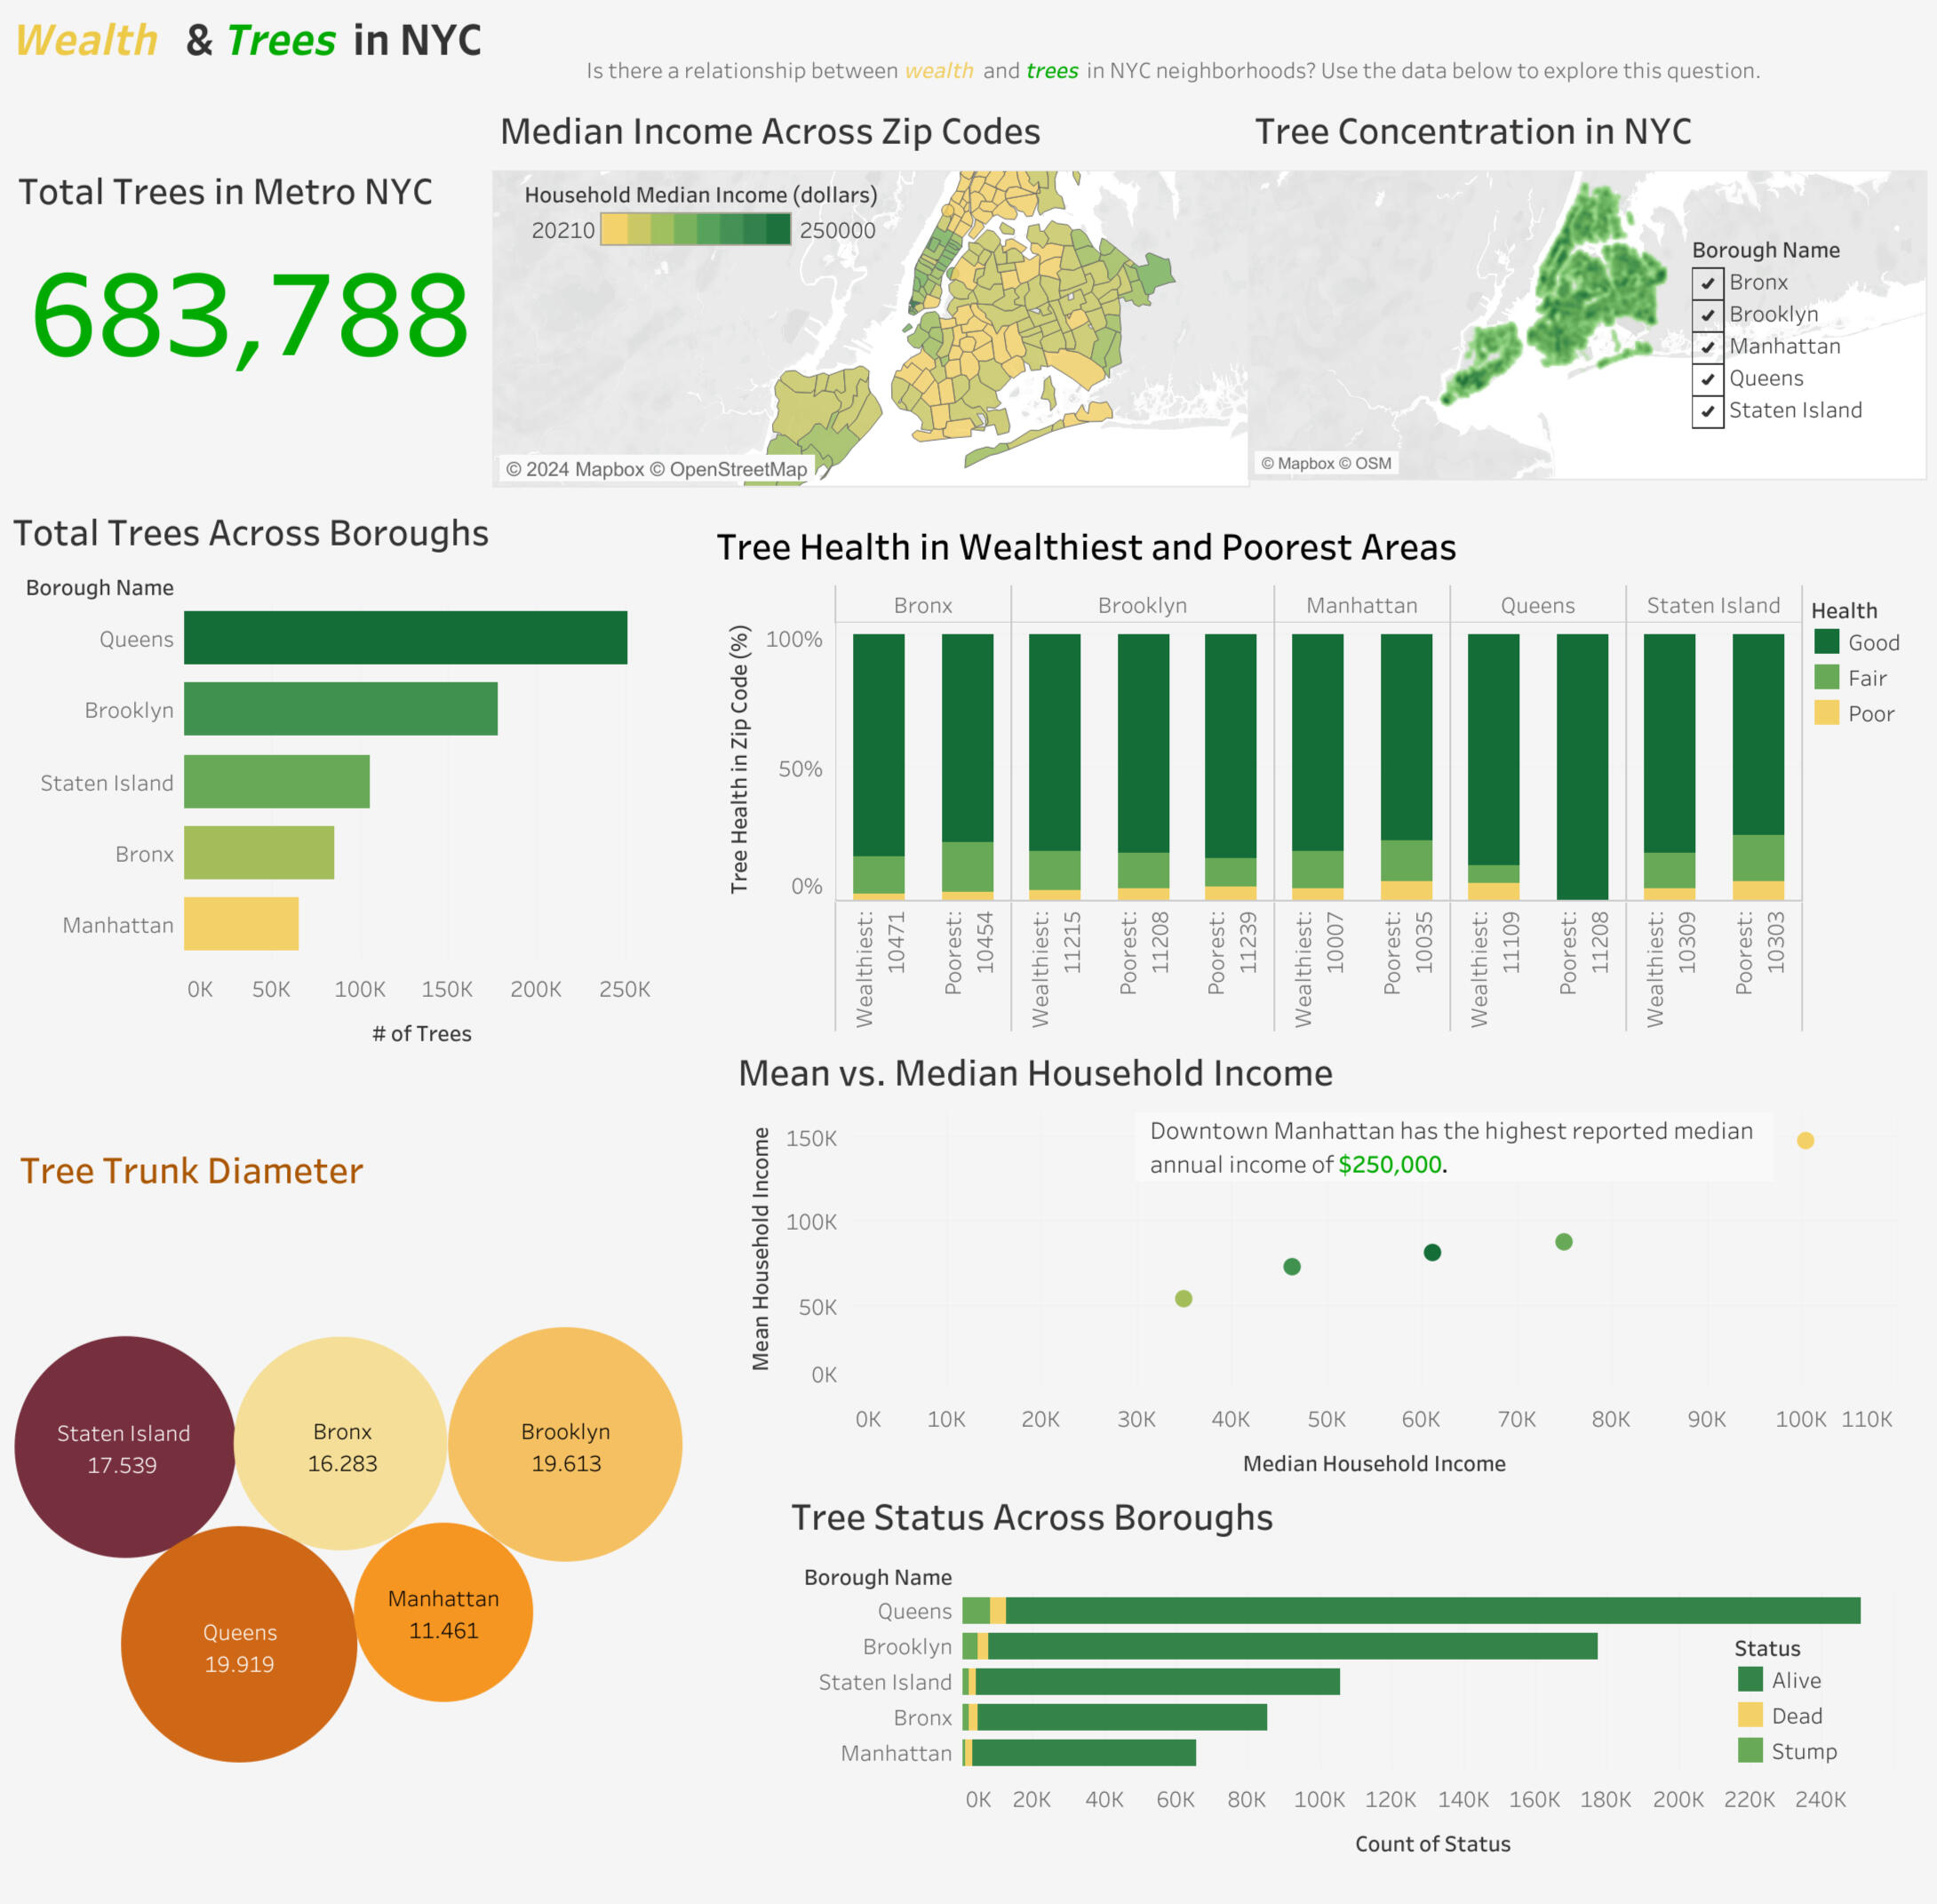
OVERVIEW:
Developed an interactive Tableau dashboard to explore the relationship between wealth and trees in New York City.DATA:
Income data across NYC’s 5 boroughs.
Tree census data from over 680k trees
The full dashboard can be viewed on my Tableau Public page: here